
Roughness prediction of FFF parts
On this page, you can predict the roughness of the parts to be manufactured by FFF or FDM, depending on manufacturing parameters such as layer height, build orientation, among others. See Figure 1-5 to understand the parameters to be considered and the tolerances to be calculated and respective equation.
The Roughness is calculated with the equation (1)-(9) [1]–[7]. The table below summarizes the input variables and equations for the roughness calculation along with the respective observations.
Roughness Equation
| Symbol | Description | Value | Observation | ||
|---|---|---|---|---|---|
| L(mm), Lt(mm), t (mm) | Layer heigth o layer thickness | 0.2 | - | ||
| α (°), θ (°) | Angle of deposition or surface angle with respect to the printing bed | 90 | Each model changes the frame of reference for angle measurement, the effective angle can be directly this or its complementary. | ||
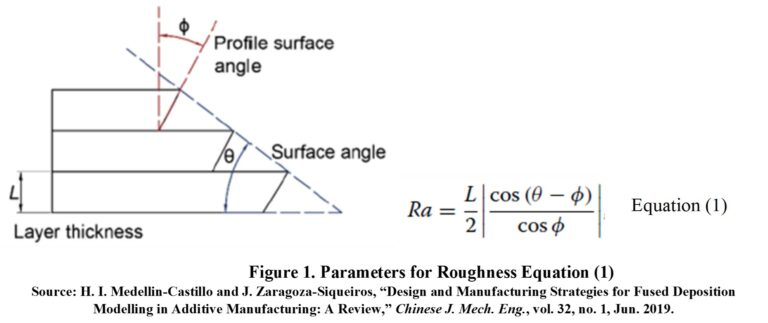
| φ (°) | Angle of the surface profile | 5 | 0<φ<15, pandey [2] fixed in 5° | ||
| w | dimensionless parameter of adjustment | 0.2 | 0,2 for systems FDM [6], [7] | ||
| R1 | Filling radius | 0.045 | 0,045 for systems FDM [6], [7] | ||
| R2 | Corner radius | 0.001 | 0,001 for systems FDM [6], [7] | ||
| Ra (μm) | L-height or layer thickness, θ-angle of surface with respect to the printing table, φ-angle of the surface profile, Ra-Roughness Ra | 8.7488663525924 | Roughness is calculated with Equation (1) [1] (see Figure 1): the original article is an algorithm to improve manufacturing time. | ||
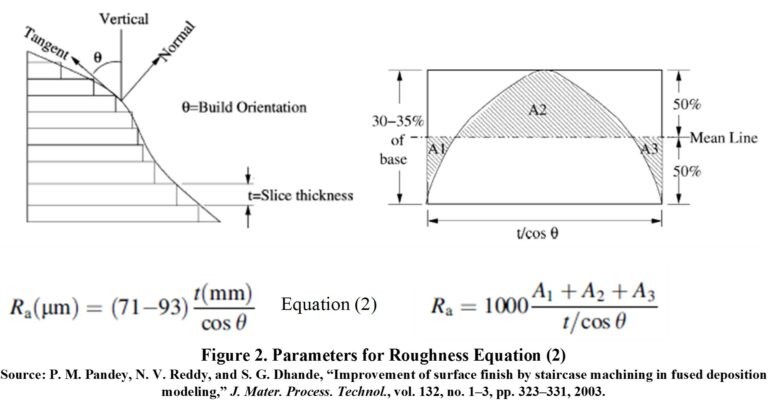
| Ra (μm) | t-layer thickness, θ-angle of surface with respect to vertical, Ra-roughness Ra | 14.2 | Roughness is calculated with Equation (2) [2] (see Figure 2): Error with respect to experiments of 2.7-16.7%, for orientation angles from 10° to 45° with the lowest errors for the lower bound model (71t/cos θ). | ||
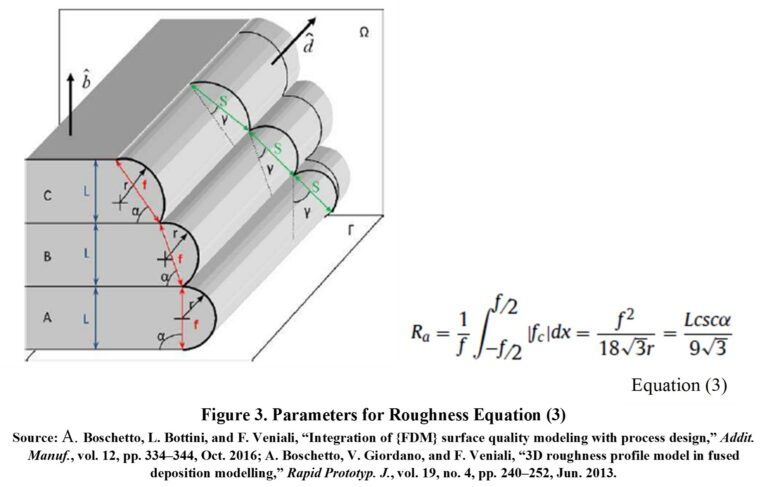
| Ra (μm) | L-height or layer thickness, α-surface angle with respect to the printing table, Ra-Roughness Ra | 12.830005981992 | Roughness is calculated with Equation (3) [3], [4] (see Figure 3): the model works properly for angles between 30 and 150°. | ||
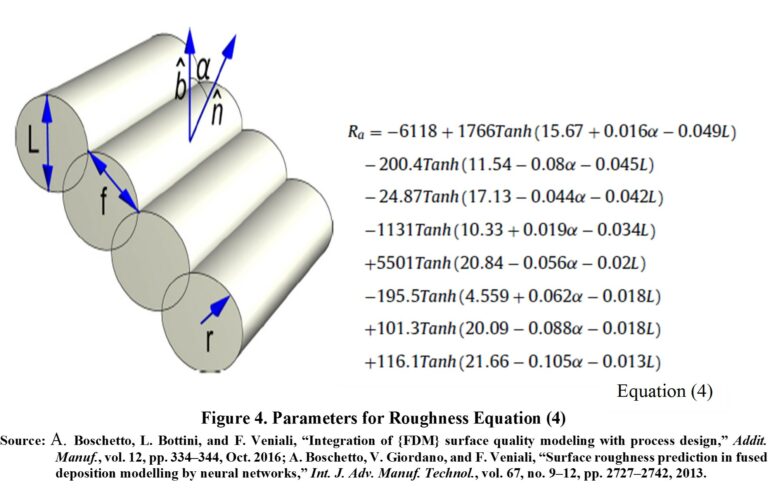
| Ra (μm) | L-height or layer thickness, α-surface angle with respect to the printing table, Ra-Roughness Ra | -185.30065773116 | Roughness is calculated with Equation (4) [3], [5] (see Figure 4): error for ABS less than 4% without angle restrictions, for any other material the error is less than 9% (FORMULA UNCONSISTENT WITH RESULTS OF YOUR ORIGINAL ARTICLE) | ||
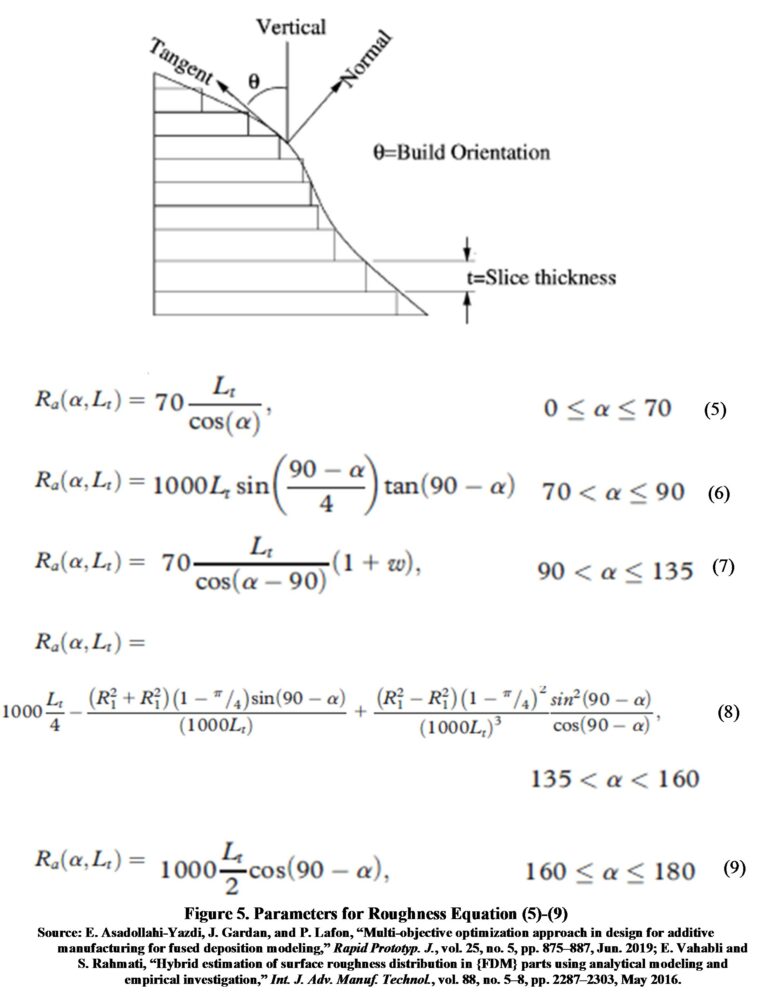
| Ra (μm) | Lt-layer thickness in mm, α-surface angle with respect to vertical, Ra-roughness Ra | 14 | Roughness is calculated with Equation (5) [6], [7] (see Figure 5): a hybrid model is proposed by merging analytical models, and finding the best accuracy ranges for each analytical model, it works for 0° to 70°. | ||
| Ra (μm) | Lt-layer thickness in mm, α-surface angle with respect to vertical, Ra-roughness Ra | #DIV/0! | Roughness is calculated with Equation (6) [6], [7] (see Figure 5): a hybrid model is proposed by merging analytical models, and finding the best precision ranges for each analytical model, it works for 70° to 90°. | ||
| Ra (μm) | Lt-layer thickness in mm, α-surface angle with respect to vertical, w-dimensional adjustment parameter, Ra-roughness Ra | 2.7436482113368E+17 | Roughness is calculated with Equation (7) [6], [7] (see Figure 5): a hybrid model is proposed by merging analytical models, and finding the best precision ranges for each analytical model, it works for 90° to 135°. | ||
| Ra (μm) | Lt-layer thickness in mm, α-surface angle with respect to vertical, R1-filling radius, R2-corner radius, Ra-roughness Ra | 190335.86725733 | Roughness is calculated with Equation (8) [6], [7] (see Figure 5): a hybrid model is proposed by merging analytical models, and finding the best precision ranges for each analytical model, it works for 135° to 160°. | ||
| Ra (μm) | Lt-layer thickness in mm, α-surface angle with respect to vertical, w-dimensional adjustment parameter, Ra-roughness Ra | 6.1232339957368E-15 | Roughness is calculated with Equation (9) [6], [7] (see Figure 5): a hybrid model is proposed by merging analytical models, and finding the best precision ranges for each analytical model, it works for 160° to 180°. |
Then, use the calculated field form by entering the different required parameters and referring to the last nine row for the Roughness.
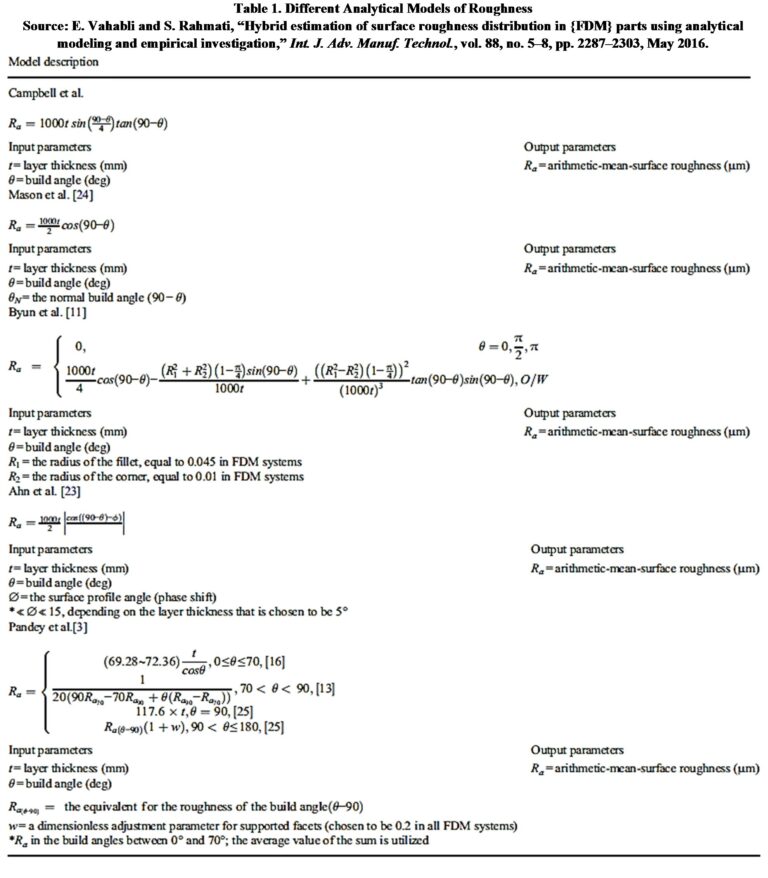
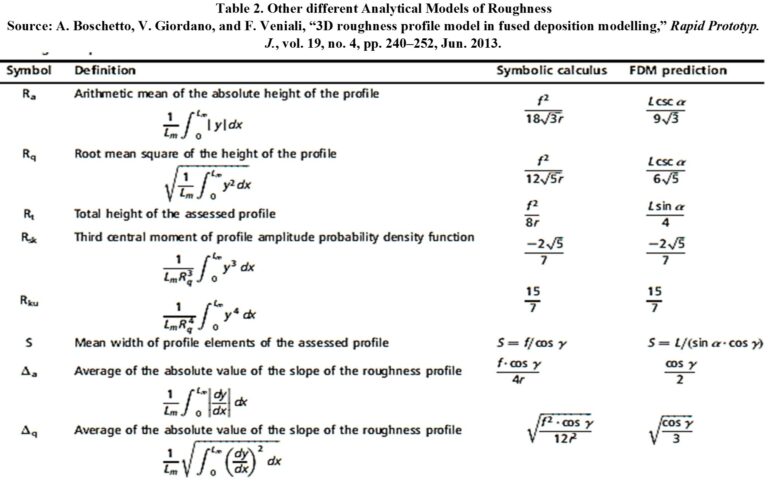
You can also consult other models to calculate additional roughness parameters in Tables 1 and 2 below.
References
[1] H. I. Medellin-Castillo and J. Zaragoza-Siqueiros, “Design and Manufacturing Strategies for Fused Deposition Modelling in Additive Manufacturing: A Review,” Chinese J. Mech. Eng., vol. 32, no. 1, Jun. 2019.
[2] P. M. Pandey, N. V. Reddy, and S. G. Dhande, “Improvement of surface finish by staircase machining in fused deposition modeling,” J. Mater. Process. Technol., vol. 132, no. 1–3, pp. 323–331, 2003.
[3] A. Boschetto, L. Bottini, and F. Veniali, “Integration of {FDM} surface quality modeling with process design,” Addit. Manuf., vol. 12, pp. 334–344, Oct. 2016.
[4] A. Boschetto, V. Giordano, and F. Veniali, “3D roughness profile model in fused deposition modelling,” Rapid Prototyp. J., vol. 19, no. 4, pp. 240–252, Jun. 2013.
[5] A. Boschetto, V. Giordano, and F. Veniali, “Surface roughness prediction in fused deposition modelling by neural networks,” Int. J. Adv. Manuf. Technol., vol. 67, no. 9–12, pp. 2727–2742, 2013.
[6] E. Asadollahi-Yazdi, J. Gardan, and P. Lafon, “Multi-objective optimization approach in design for additive manufacturing for fused deposition modeling,” Rapid Prototyp. J., vol. 25, no. 5, pp. 875–887, Jun. 2019.
[7] E. Vahabli and S. Rahmati, “Hybrid estimation of surface roughness distribution in {FDM} parts using analytical modeling and empirical investigation,” Int. J. Adv. Manuf. Technol., vol. 88, no. 5–8, pp. 2287–2303, May 2016.